Decade and MLB consultant for over two decades) and Fred Claire (World Series-winning general
manager of the Los Angeles Dodgers and member of the club’s front office for 30 years.)
Media is welcome to use this information. We would ask for a reference and, if possible, a link to AriBall.com.
###
 Photo by USA Today
Much discussion has come up about Starlin Castro’s questionable performance as a shortstop for the Chicago Cubs. As a 20 year old, Castro burst onto the MLB scene with a .300 batting average, a .800 OPS, and a league average WRc+. There was much hope that Starlin Castro would be a cornerstone piece for the Cubs and a potential transcendent shortstop at the MLB level. However, as this season is showing, Starlin Castro, now 25, is showing many inconsistencies in his game from his batting/fielding performance that he has shown in the past. The question going forward is whether this season is an anomaly or if there is a lot to worry about Starlin’s future in MLB.
In order to properly evaluate Starlin Castro’s performance, I ran a regression model based upon the cost of a win in MLB free agency. By using a model based upon MLB free agency, we can properly understand the cost of a purchased win in MLB. By looking at a 3 year average of Starlin Castro’s Wins Above Replacement (WAR), Castro’s current valuation is $7,633,602 per year (Figure 1). Yet, this season, Starlin Castro is delivering negative $2 million in performance. Thus, if we think about Castro’s actual value versus expected value, Castro is performing at a loss of $9 million beneath his expected value. The questions are; what is causing him to perform well below his expected value and whether he can repair his stock with almost half a season to go.
One worrisome sign of Starlin Castro’s poor season has been his non-existent power. Through 289 plate appearances, his slugging percentage is .348 with most of his hits being singles. Last season, he seemed to have a breakout season with 33 doubles, 14 home runs, and a slugging percentage of .438. However, this season, the main culprit of weak power numbers is the fact that he is making a lot less hard contact than he has in the past. From last season to this season, his ground ball rate has increased 12% (from 45% to 57%) and his line drive rate has decreased 6% (from 22% to 16%).
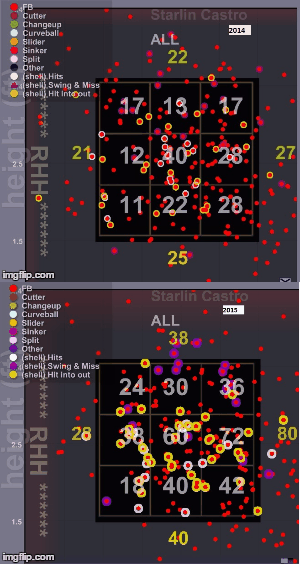
As shown in the gif below, right-handed pitchers have evidently changed their approach to pitching against Starlin Castro. During this season, 56.2% of all pitches have been fastballs. Compared to last year, right-handed pitchers have been attacking the outer half of the strike zone and, in addition, forcing Castro to chase pitches out of the strike zone. This simple approach has caused Starlin Castro’s soft contact percentage to increase by 8.7% from 2014 (16% to 24.8%) and his swinging strike percentage to increase by .7% from 2014 (9% to 9.7%). With obvious holes in his plate discipline, pitchers have feasted upon his impatience and, evidently, Starlin Castro has struggled at the plate.
GIF 1: All Fastball Pitches from 2014 to 2015

In terms of defense, Starlin Castro has never been a wizard at the shortstop position. However, during this season, Castro has struggled mightily with -6 defensive runs saved. In addition, through 68 games, Castro has more fielding errors than he had all of last season. A move to another position could prove to be beneficial for Castro, but could prove to be even further damaging to his current stock value on the trade market because of the batting production he has produced at the shortstop position in the past.
Starlin Castro has always been rated as a below average defender, but an above average batter. However, this season, pitchers have simply adjusted their approach to Starlin Castro’s impatience at the plate and have been successful at limiting his success as a hitter. Most evidently, Castro has underperformed well below his projected value of $7 million and has put his stock value at an all-time low. Throughout Castro’s career, he has never been a patient batter at the plate with a career walk rate of 5.1% and a career strikeout rate of 15.3%. Still, with both of these rate statistics going in the opposite direction this season, Castro needs to exhibit more patience and selectivity to produce more successful results at the plate. For the trade market, I think Starlin Castro is the perfect buy-low candidate because he has shown ability to produce with his bat in the past at a position of low batting production value. However, a lot of his success going into the future will be dependent if he can make minor adjustments to how pitchers are now pitching to him.
Figure 1: Regression Model to finding cost of a Win Above Replacement (WAR)

References:
1. "Baseball Reference." Baseball-Reference.com. Baseball Reference, n.d. Web. 14 Apr. 2015.
2. "Baseball Statistics and Analysis | FanGraphs Baseball." Baseball Statistics and Analysis | FanGraphs Baseball. N.p., n.d. Web. 24 Apr. 2015.
3. Krautmann, A. C., and J. L. Solow. "The Dynamics of Performance Over the Duration of Major League Baseball Long-Term Contracts." Journal of Sports Economics 10.1 (2009): 6-22. Web. 24 June 2015.
NOTE: All statistics accurate as of 06/26/15
By Sanjay Pothula
AriBall.com